Performance issues
The following page can be used to diagnose performance issues in PARS. Some potential solutions for common issues are listed on this page, but the information shown below is not a definitive list of the causes and solutions for performance issues.
At TASC we will try to help our customers wherever possible but it is important to note we are software specialists, not network managers or server engineers.
We have neither the remit nor the expertise to log on to your server and resolve performance issues for you.
In a well configured environment (comprising of the IIS server, the SQL server and the network) PARS will run quickly. Any performance issues are the result of issues in the environment, not the result of the PARS programming.
Contents
Determining if PARS is Running Slowly
Hold down CTRL and SHIFT when opening a register from the main PARS Connect diary page. Any register will do.
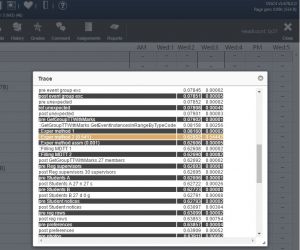
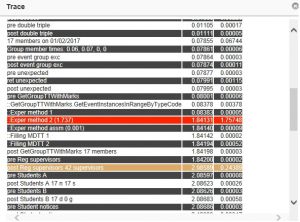
This will open a Trace Window when loading the register. The Trace Window records the exact times taken by various functions required to open a register. On a decent system a register should take less than 5 seconds to open. On a well-configured system a register will take less than 2 seconds to open.
If the register takes longer than 5 seconds, examine the times in the Trace window to see what is taking a long time. You should repeat this a few times to get consistent/average timings.
The "Exper method 2" should always take the longest amount of time. This is the process of retrieving attendance marks from SIMS. Nothing in either PARS or SIMS can be changed to improve this time; if Exper method 2 is taking too long then reconfiguring the system is the only way to improve performance.
Exper Method 2 should take less than 3 seconds; if it does not, follow the instructions below. If Exper Method 2 take less than 3 seconds then check the other times in the Trace Window. Several times highlighted in orange or red indicates an issue with the SQL server.
If the register is taking more than 5 seconds to load, Exper Method 2 is taking less than 3 seconds and one or two times in the Trace Window are highlighted in orange or red, post a ticket on the helpdesk with a screenshot of the Trace Window.
In any other case, the root cause of performance issues in PARS lies with either your IIS server or your SQL server (or both).
Identifying the Issue
In general terms any performance issues will be lie with either the IIS server (due to overuse) or with the SQL server. Use this page to decide whether it is the IIS server or SQL server causing the issue:
PARS main menu > System management > System > Performance monitor
IIS
The easiest to rule out (and to fix) is the IIS server.
The main indicator to IIS throughput is the Processor Queue Length. This should read 0 nearly all of the time, occasionally flicking up to 1 or 2. A Processor Queue Length consistently higher than 0 is a problem.
All four LEDs should be green. If any are yellow or red, there is a problem on the IIS server which must be resolved. You may not have enough memory, enough cores that are fast enough to cope, a failing or slow disk drive that cannot keep up or a poorly performing Network Card.
Running the IIS server as a Virtual Machine can cause additional problems; Power Saving features can be left on and there may be settings on the Host to limit CPU performance to a percentage of the host's capability (nominally to maintain CPU cycles for other VM guests) that will have the effect of crippling the IIS server's performance.
SQL
If the IIS server is running well turn your attention the the SQL server. This will have the same potential pitfalls and more when running as a virtualised machine and sharing the host with the IIS server.
SQL bottlenecks will be either CPU, Memory or Disk
If your CPU graph on the SQL tab is maxed out nearly all the time CPU is probably the limiter. Increasing the number of cores or upgrading the existing cores will solve this issue.
If there is a high drive level latency, Disk access is probably the limiter. Check that:
- Your SIMS database is running at the right compatibility level
- There is enough free space and that your log files are not being overused (On screen warnings about long wait times are a very bad sign)
- Close and Shrink are not enabled
If the LED for memory is green then available memory is unlikely to be an issue. If the LED is not green, increase the memory available to the SQL server.
A very realistic test of the SQL server can be performed using the following:
PARS main menu > System management > Management reports > Table speed test
This is a stress test that attempts to write a number of records to the SIMS and PARS databases, update them and then delete them. This will give a baseline figure as to the performance of the SQL server. You should expect to get around 2 minutes each for the longest PARS tests and 3 minutes each for the longest SIMS tests. If they are much longer than expected, your bottleneck is with the SQL server.
Potential Resolutions
Automation
Automated tasks or reports may increase the load on the SQL server. You can find a list of the automated jobs and their scheduled run times via:
PARS main menu > System management > System > Automation > Job list
If any of your jobs are scheduled to run during busy times (typically 8am - 5pm) then consider rescheduling them to run at a quieter time. Jobs can be rescheduled by clicking the magnifying glass button next to their title. These changes will not take effect until the following school day, so you will need to wait until then to observe the performance of PARS.
Automation should also build data caches so that end users do not have to. To test that automation is building the caches go to:
PARS main menu > System management > System > Cache viewer
Each of the PARS caches is listed on this page. Some of the caches should have a yellow background, indicating they were built by the automation module. If none of the caches have yellow backgrounds, check that automation is running by going to:
PARS main menu > System management > System > Automation > Status
If automation is running but not building data caches, run a PARS Service Pack.
Blockers
Sometimes poorly written or recursive SIMS User Defined Reports, amongst other things, will require access to SIMS datatables for a long time which denies access to those datatables for other users. Other users are then forced to 'queue' until the datatable is unengaged. The blockers tab of the performance monitor page will show whether this is happening:
PARS main menu > System management > System > Performance monitor
Note than some unobtrusive blocking is normal, so use your judgement as to how frequently and for how long blocking occurs and from which workstation and products, and whether this is a root cause or a symptom.
PARS Tweaks
Some tweaks in PARS itself may be possible to improve performance but these are likely to only affect certain areas of the system, such as saving behaviour incidents. The following report will indicate the settings in PARS that may affect performance:
PARS main menu > System management > Management reports > Performance
SQL Server
This is not a definitive list of potential issues on the SQL server, but many of the issues listed below have been observed as the cause of performance issues in live school environments.
- Running antivirus on the SIMS MDF and LDF data files
- Huge LDF files from not backing up and shrinking them
- Power Management settings on the VM Host powering down the Host CPUs to x% to save power
- Limiting VM CPU to tiny percentages of the host
- Adding more cores to VM Guests than the Host actually comprises
- Limiting the SQL server to run on a single CPU with Processor Affinities
- Using the default Microsoft NIC driver on a VM rather than the correct manufacturer's driver
- Having SQL and IIS on the same physical server
- Having the SIMS MDF and LDF files on the OS volume
- Having the SIMS MDF and LDF files on a fast SSD, but leaving the frequently used TempDB on a slow mechanical drive
- Not performing routine housekeeping such as archiving SIMS attendance data or scheduled Database re-indexes
- Third party tools running constantly against the SIMS database or running during peak times
- Having RAID set to WRITE THROUGH and not WRITE BACK
The following configurations may positively affect the performance of the SQL server:
- Host the SIMS ldf and mdf files on separate physical drives (not on separate partitions of the same physical drive)
- Use RAID 10 to maintain the SIMS ldf file over two separate drives. This requires specialist hardware and may be costly


